Let’s Talk About Metrics in Tech-Driven Companies
By Bastian Buch

Shall we speak about engineering metrics? Again? Yes, we should. I have been working in Tech Companies for 20 years and one thing has never really changed: the heated debates about what to measure, how to measure, and what to do with the data we capture.
Just recently, McKinsey published an article about measuring developer productivity, and thought leaders like Kent Beck and Gergely Orosz, among many others responded, sometimes almost in rage, sometimes with a more practical perspective.
After these enriching years in leadership, here are my nuggets of wisdom that I deem universal. Whether you’re an aspiring engineering manager, a seasoned middle manager, or the technical co-founder of a startup, these insights will resonate with you.
This is not a new discussion. I remember myself debating passionately with one of my first managers, also a former McKinsey consultant, about how to performance manage Software Engineers. Can you do it on an individual level? What are metrics in an engineering context good for? How can we know if an individual or a team is good? How do we know if someone deserves a bonus? So many questions.
A lot has happened since then: Agile practices have been adopted by almost all engineering teams around the world: Velocity, WIP, Cycle Time, Cumulative Flow, and many other process-related metrics have become our everyday companions. Additionally, the DevOPS movement started to shed a light on operational and infrastructure metrics (e.g. DORA). Also, with cloud engineering, the commoditization of measurement tools such as Grafana or Kibana, and the adoption of data analysis and visualization tools like Jupyter or libraries like D3.js really created a foundation for engineering teams to truly become ‘data-driven’ in the best sense.
Yes, a lot has changed and improved, and we still have the same or at least similar discussions I had 20 years ago. The same questions about the why, when, how, and who keep executive teams of startups and also established companies busy. Why is that? What’s missing?
I think the missing piece in a lot of companies is the actual operating model or framework in which metrics are used. Different people, teams, functions, and management layers have different and sometimes even competing views on what metrics are actually good for. Metrics and tools are still used in isolation. In the heroic efforts of functional leaders introducing tools and metrics they have used before (or just read about). A CEO with a sales background might not (yet) understand that measuring throughput or commits on an individual level can’t be a good measure of the performance of single team members. A CMO might not understand why it might be better to spend more budget on an internal engineering team building the company’s digital product instead of hiring an external agency to do the same job.
With this article, I’d like to share some of my thoughts and experiences with you. I don’t have the ambition to offer a complete overview of the topic or even to be right about this. But as much as these ideas have helped me and the teams I’ve led before, they might also help some of you.
What Metrcis Are (For Product & Engineering Organizations)
Yes, metrics are a good compass for management steering. In the oftentimes vast portfolio of operations, metrics act as a guiding element, providing direction and allowing leaders to steer their teams effectively towards desired outcomes. The question is: which metrics are useful and which are not? More about this later in this article.
Metrics are also a tool for self-improvement. The “self” can be an individual, a team, an organization, or even an entire company.
Organizations are groups of people working with each other to accomplish a common goal. How is this possible with people from different backgrounds, different languages, different personalities, and different ambitions? Metrics are (imho) the best way to align goals and priorities, to have a common language for strategic decision-making, and to discover opportunities and risks.

Metrics are not a tool to micromanage teams or individuals. It is (still) a common misconception that metrics are there to scrutinize every action of teams and individuals. While they provide data and insights, they shouldn’t be used to micromanage from the outside.
While data and facts are important, they are not the cure for all evil, they are not even the cure for a bit of evil. They are not solutions, they are simply tools, and for some problems, they are not even the right tools. They need to be complemented by intuition, instinct, experience, creativity, and a deeper understanding of context.
Metrics are also not the ultimate goal. They are a means to an end, not the end itself. They are only signals for you to understand if and how well a certain goal was achieved, but a number on a slide, even if it is dark green, does not count as success.
Building a Data-Driven Organization Requires a Company-Wide and Clear Understanding
When building a data-driven organization, it’s not simply about collecting vast amounts of data or having an array of dashboards visualizing it. Nor is it solely about hiring a data or product analytics team. Being a data-driven company requires a culture and operational model that position data, scientific rationale, and evidence-based reasoning at the forefront of nearly everything. Discussing data carelessly, intertwining contexts, and lacking foundational knowledge about the data and its structure can instigate widespread randomness and misalignment.
To cultivate a genuinely data-driven organization, one must grasp the hierarchy of decision-making and performance evaluation. This structure guarantees that every action taken resonates with the organization’s overarching objectives. Concurrently, all decisions and actions within an organization intrinsically follow a sequence, which leaders must understand and vigilantly oversee:

If this appears rudimentary: Kudos to you, well done! It’s staggering how many companies blur these lines. Your weekly meetings, status updates, dashboards, and so on should mirror a collective understanding of this structure and how it represents your business. Recognizing your business objectives helps in setting goals. These objectives, in turn, guide you to appropriate KPIs that determine if you’re on the desired trajectory. It’s paramount to have clarity and alignment about which KPIs are pivotal for accurate metric-level measurement.
Simultaneously, discerning whether a specific KPI or target measures input, process, output, or the outcome of your enterprise is crucial. Outcome measurement is challenging. Hence, selecting good lead indicators becomes an important exercise.
Consider the following example: if you offer a ticketing app for buses or trains, your paramount business objective might be to become the first choice when individuals want to buy a train ticket. Assessing this is daunting, since we can’t measure thoughts (as of now). While surveys about brand recognition can be conducted, they may not be wholly reliable due to potential contextual voids. A plausible hypothesis might be that users will only return if they consistently have a seamless experience with your app, especially given the myriad of alternatives available. Therefore, a goal could be that customers return multiple times within a year, or the ratio of one-time to recurrent buyers remains below 0.5. This serves as a robust KPI at the outcome level for team focus.
Supporting this from an engineering standpoint, leading indicators for these KPIs can be explored. The challenge arises because most metrics at this level refer to input, process, or maybe output. An effective output metric might be the count of uninterrupted sessions, the ratio of completed to lost transactions, or even the number of resolved incident root causes. Emphasis can be placed on the process level, ensuring rapid issue resolution or bug fixes within a strict timeline. For input, a metric might consider the time allocation for code quality enhancement. The true art isn’t in exhaustive measurement but in understanding the ‘why’ and clearly delineating between business metrics, goals, targets, KPIs, and other metrics.
Metrics Follow Two Directions: Outside-in (Metrics About) And Inside-Out Metrics (Metrics For)
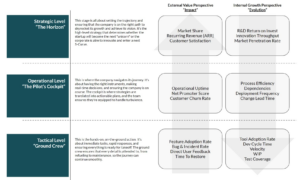
Another important aspect of creating a data-driven culture is understanding the audience for your metrics, KPIs, targets, and goals and determining their purposes. Within each layer of an organization — be it strategic, operational, tactical, or individual— there are two vital perspectives:
- The external value perspective
- The internal growth perspective
At the strategic company level, the external perspective might encompass metrics such as market share, market capitalization, recurring revenue, or even customer satisfaction. While these metrics provide external stakeholders with insights into your value proposition, they aren’t necessarily instrumental in fostering internal growth or improvement. Thus, in addition to these outcome-focused, external metrics, it’s essential to adopt an internal growth perspective that promotes continuous improvement and evolution.
This dual perspective is especially important for product engineering teams. Internally-focused metrics like velocity, work in progress (WIP), development cycle time, and test coverage are crucial for maintaining team health, enhancing delivery capabilities, and scaling in tandem with the company. As a leader, your role is to inspire teams to leverage such metrics effectively, ensuring they aren’t merely numbers but tools for improvement. It’s not about the specific figures, but the broader implications. Conversely, from an external perspective, the focus shifts to metrics like feature adoption rate, bug rate, and direct user feedback. Don’t mix these up! Test coverage does not say anything about how good the company is, and your share price does not indicate if the engineering team is in a good position.
Curate YOUR Set of Operational Metrics
The silver lining is that the area of engineering metrics offers an abundance of established metrics, frameworks, and tools. This means that constructing metrics isn’t the real challenge. Instead, the art lies in selecting the right ones and weaving them into your daily operations, so they resonate with your team and stakeholders.
A great place to begin is with the DORA and SPACE metrics, which both center on work, processes, and the team dynamic. Avoid getting too involved in debates over the utility of these metrics. Instead, immerse yourself in understanding your unique context and business objectives. From there, curate a set of metrics that genuinely matter to you and your team.
Also, don’t overlook cost, application, and system-based metrics. Pinpointing the ideal metrics for your particular scenario demands rigorous effort and deep collaboration within the team. Your dashboards and reports should act as your secret arsenal, enabling swift reactions and keeping you informed about ongoing developments.
It’s crucial to stress once again the importance of interconnecting metrics. Aim to use ratios wherever feasible, and design your dashboards and charts in a manner that fosters insight rather than just presenting you with a stream of raw numbers. Each and every look at your dashboard should create value instead of more confusion. If something is broken or not working as intended, ideally one glance at your dashboards and data should provide insight about what happened, where, and possibly why.

How to Introduce Metrics and KPIs to Your Organisation
Start with Your Culture
Before measuring anything and before scheduling your first metrics meetings, it’s essential to enable a culture that values data-driven insights. Prioritize a mindset that favors facts over opinions. Foster an environment that embraces scientific approaches to problem-solving, highlighting the importance of insight, thorough reasoning, and evidence-based conclusions. Metrics and KPIs will be most effective in an environment where they can be interpreted and applied thoughtfully, rather than merely viewed as numbers. This starts with you as a leader, you need to be a role model in this. If you are not obsessed by insight and facts but rather act based on your instincts and gut feeling, don’t be surprised that your team won’t use data as effectively as it could.
Agree on what to Measure
Deciding what to measure is as important as how you measure it. Focus on metrics that align with your business objectives and values. These metrics should provide actionable insights that can drive the business forward. Equally important is identifying and eliminating metrics that aren’t relevant. Streamlining your metrics ensures clarity and purpose in measurement, avoiding data clutter that can muddy decision-making.
Democratize Your Data
Transparency is the foundation of trust and innovation. By making most of your data accessible to all team members, you empower them to interact with the data, derive new insights, and draw correlations that might not be immediately evident. When employees have the autonomy to ‘play’ with data, it encourages a culture of curiosity and innovation, often leading to unexpected and valuable findings.
Think Holistically
A siloed approach to metrics can create a fragmented view of organizational performance. The leadership team should ensure that metrics from various departments, be it business, sales, marketing, product, or tech, are harmonized. Establish a cohesive system that offers context and facilitates informed decision-making across all functions. This integrated approach ensures that everyone is aligned with the company’s overarching goals and objectives.
People Development
Embracing a data-driven approach requires more than just access to data; it demands the skills to interpret and utilize that data effectively. Investing in your team’s development in areas like data analytics, understanding standard KPIs, visualization techniques, and even mastering spreadsheets is crucial for being successful as a data-driven company. Make these competencies a part of everyone’s learning journey to equip the entire organization well for leveraging the power of data and insight.
Phased Rollout
Rome wasn’t built in a day, and neither should your approach to metrics. Begin with basic tools and essential metrics. This allows for testing and alignment and ensures everyone is on the same page. Find quick wins — these can boost morale and demonstrate the value of a data-driven approach. Activities like sharing weekly data stories can engage your team and stakeholders, highlighting the tangible benefits of integrating metrics and KPIs into your organization’s operations and how these can enable everyone’s creativity and innovation.
Best Practices and Anti-Patterns
Last but not least, let’s look into some best practices and anti-patterns. As you journey through the landscape of metrics and KPIs, it’s crucial to understand not only the tools and techniques but also the pitfalls and shortcuts. The following guidelines will provide some dos and don’ts, ensuring that your metrics-driven approach is both effective and sustainable.

Best Practices:
- Push Over Pull: Instead of making data accessible only on demand, actively push it to where people already are. On-site, display dashboards in communal areas, like by the coffee machine. Remotely, use tools like Slack to share insights and ensure that standard dashboards are easily accessible.
- Favor Ratios: Ratios often provide a more comprehensive picture than absolute numbers, offering context and deeper insights.
- Embrace Visualizations: Visual representations make data more digestible and insights easier to grasp. Raw data, without interpretation, can be misleading.
- Comprehensive Dashboards: Instead of isolated metrics, combine them to provide a holistic view of the situation or performance.
- Standardize Tooling: Using standard tools ensures consistency, easier training, and more reliable data handling.
- Right Visualization for Right Metric: The choice between, for instance, a bar chart and a line chart can greatly influence interpretations. Think critically about which visualization conveys your data best.
- Consistent Presentation: Whether it’s the color scheme, chart types, or terminologies, maintaining consistency makes data interpretation more intuitive and reduces the risk of misunderstandings.
Ant-Patterns:
- Micro-Management: Instead of nitpicking minor fluctuations, like “why did team A have 5 story points less?”, focus on bigger trends and broader insights.
- Metrics Paralysis: Too many metrics lead to decision paralysis and confusion. Prioritize and streamline metrics to capture what’s truly important.
- Ignoring Timeframes: Always contextualize metrics with timeframes. A temporary dip might be insignificant in the grand scheme of things.
- Isolated Metrics: Never view metrics in a vacuum. Context matters immensely, and a singular metric without related data can lead to skewed interpretations.
- Metrics-Based Compensation: Tying compensation directly to certain metrics can result in unintended consequences and behaviors.
- Not Questioning Metrics: Metrics are tools, not truths. Regularly reassess and question the relevance and accuracy of your metrics.
- Over-Reliance on Numbers Alone: While data is invaluable, it’s essential to balance it with intuition, experience, and collective intelligence. Don’t steer your business solely by numbers; human judgment is irreplaceable.
If you’re keen on introducing the right engineering metrics to your organization or wish to assess your current setup, our team at Philipps & Byrne is eager and equipped to support you on this journey. Reach out, and let’s build the future together.
Resources
- Occam’ Razor – Blog by Avinash Kaushik
- Measure Everything (Etsy)
- Metric Driven Engineering (Etsy)
- How to improve efficiency in your team (Lena Reinhard, Expert at Philipps & Byrne)
- From ‘The Pragmatic Engineer’:
- Bastian Buch on Linkedin about Metrics
- DORA Metrics
- 4 Golden Signals
- SPACE Metrics
- Not directly about metrics, but team maturity: Agile Fluency (ThoughtWorks)
- Modern Agile Product Teams by Marty Cagan
- Accelerate, Book & Video about Building High Performance Tech Organizations
About the Author
Bastian Buch is Executive Tech and Product Advisor at Philipps & Byrne. He possesses profound tech expertise and experiences from working with some of the most successful tech companies in Europe. Over the last 16 years, Bastian has worked as Engineering Manager and Head of Technology at Scout24, and an Engineering Director at companies like travel tech unicorn Omio, food and grocery delivery giant DeliveryHero, and Europe’s fashion ecommerce champion, Zalando. He is also co-founder and Managing Director of one of the biggest global non-profit mentoring platforms The Mentoring Club.